The purpose of this study was to determine whether it is most beneficial to go first, second or third in a game of Cut-Throat (see below for games rules). Generally, the order of the game is decided by a game of Rock, Paper Scissors, with the winner getting to choose his/her starting position. So if you win the game of Rock, Paper Scissors, which starting place should you choose?
To answer this question, I kept track of the starting order and finishing order of 36 different games among players of similiar skill. The starting order of each game was randomized by a game of Rock, Paper Scissors, although the winner didn’t get a choice of his/her starting place, as is customary. The winner had to go first, second place second, and third last. This randomized starting order makes the assumption that Rock, Paper Scissors is truly a random game but the results weren’t as clear.
Cut-Throat is a billiards game played with three people. After making one ball, each player gets to decide which suite of balls they want; either lows (1-5), mids (6-10) or highs (11-15). Rather than pocketing your own balls, the object is to pocket all of your opponent’s balls.
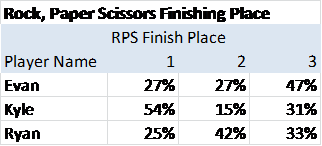
Is three-way Rock, Paper Scissors (RPS) really random?
Not really but it was close enough. In theory, the results below should show each player finishing in each place 33% of the time— but it didn’t. 11points.com has a couple theories on why the game isn’t truly random.
- Your brain is always making choices, whether you know it or not. In order for the game to be random, your choices would have to be random as well.
- Larger studies show people throw paper 30% of the time and Rock and Scissors 35% of the time each.
- People will often throw whatever just beat them.
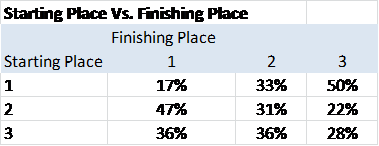
Given the option, should you go first, second or third in Cut-Throat?
You should choose to go second! Maybe third overall but you definitely don’t want to go first. The graph below shows the player who goes second wins 47% of all games, vs. 36% for the third player and only 17% for the first player.
Graph 2.1
Graph 2.2
Graph 2.3
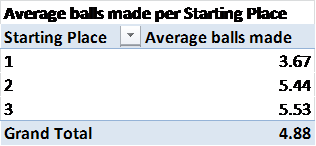
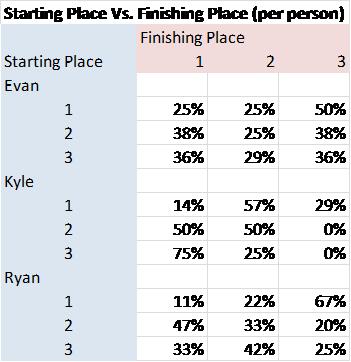
- The first player is doomed from the start, making only 3.7 balls per game compared with players two and three pocketing about five and a half (see 2.1). The first player only made a ball on the break about 25% of the time, leaving several opportunities open for players two and three to take control on the game. This is true across all players as shown in graph 2.2.
- Going second is usually the most favorable; however note that the third player makes the most average balls per game (see 2.3). Nonetheless, second place still wins more games overall because they get one additional turn in a victory (meaning if they pocket the last of the opponent’s balls player three doesn’t get an opportunity to respond).
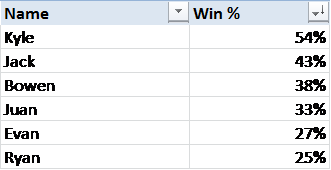
Who is the best player of the group?
Unfortunately, it’s not me. Winning more than 33% of all games means you’re an above average player. There’s not an exact correlation between balls made and Win % but I would say our best players are Kyle, Bowen and Evan. Impressively, Kyle had the highest win percentage despite the highest percentage of being forced to go first (the worst starting position).