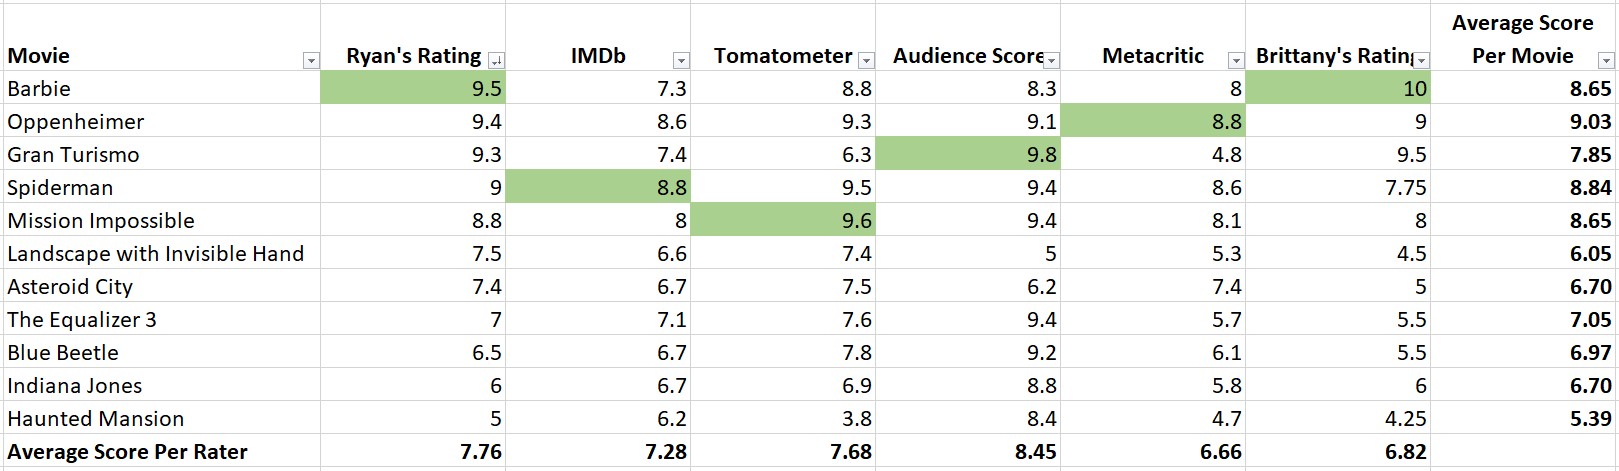
Over the past year, Brittany and I have embarked on a cinematic journey, watching 46 movies in theaters over 365 days. From Halloween thrillers to box office flops, this has sparked our curiosity to learn more about the trends and insights into the movies we love. Join us as we dive into the data behind movie budgets, ratings, and profits, along with a brief refresher from your high school statistics class.
We prefer to go on Thursday’s when new movies are released. We saw 24 of 46 movies on opening weekend

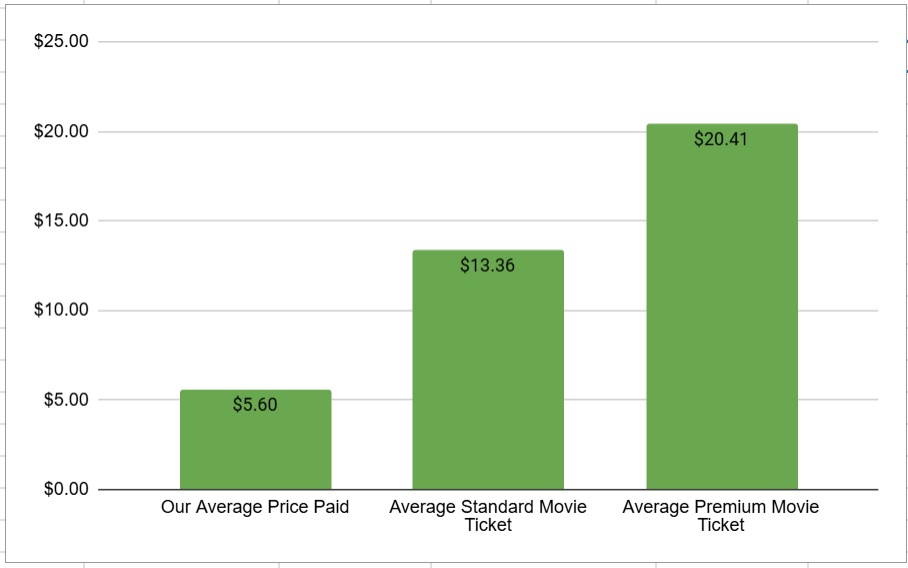
Using the AMC A List (movie subscription pass), we paid ~$5.60 per ticket; 59% less than a standard ticket ($13.36) and 73% less than an Imax/Dolby ticket ($20.41)
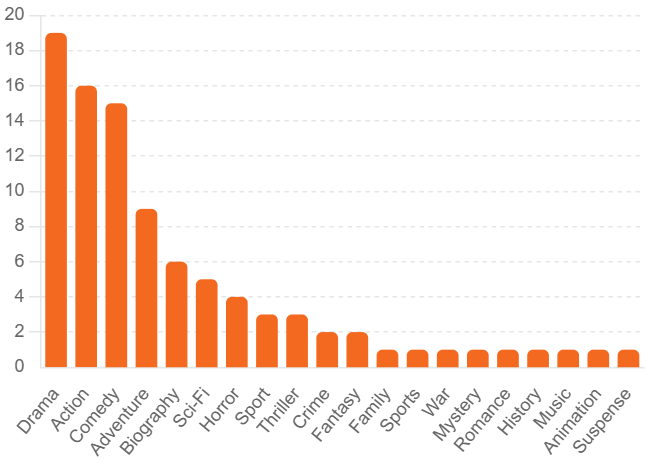
Most of those movies we saw were dramas, action movies, or comedies (note some movies had more than one genre)
We saw six movies from both Paramount Pictures and Sony Pictures

Ready to dive deeper into the stats?
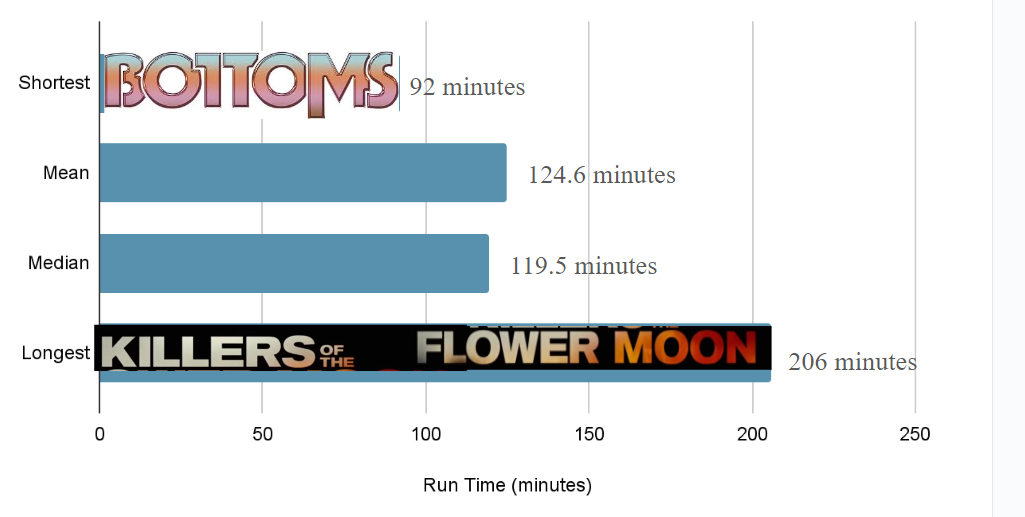
You could watch the shortest movie (Bottoms) 2.2x before the longest movie is over (Killers of the Flower Moon).
Of all the movies, these were the biggest financial hits (at least for opening weekend), generating more box office revenues during opening weekend (red) than the film’s budget (blue)

Generally, the production company gets to keep 50-60% of the box office revenues from opening weekend and the theater owner get to keep the remaining 40-50%. However, this split is contentious and often varies based on the strength of the film and the bargaining power of both the production company and the theater. After opening weekend, that split often shifts over subsequent weeks such that the production company’s cut decreases and the theater’s share increases.
There are plenty of exceptions but opening weekend box office revenue carries an outsized importance because it often sets the tone for the film’s entire theatrical run. By Sunday of opening weekend, studio executives can predict with great accuracy what a movie will earn by the time it leaves the cinema. Ticket sales are the largest driver of income for movies, although not necessarily the most profitable because of taxes and the cut owed to the theater. Other sources of revenue for the production company include DVD sales, on-demand rentals, licensing income from streaming services, and merchandising.
This reliance on opening weekend box office revenues is changing though. Film critic Bilge Ebiri explained, “Hollywood is in the midst of a transition… [they’re creating] Fewer gigantic productions that need massive opening weekends to justify their humongous costs; [and] more solid films that can turn a profit over a few weeks and months thanks to good word of mouth. The smash-and-grab opening-weekend strategy was never going to be sustainable, and the industry had become alarmingly reliant on an increasingly small handful of titles saving their bottom lines.”
This transition may include a larger reliance on sequels and related works. Of the five movies above, four aren’t entirely original stories. Barbie has the doll, Five Nights at Freddy’s is based on a video game, and Spider man and Maxxxine are both sequels. In total, 14 of the 46 movies we watched were direct sequels or part of a movie series, and several more were based on books or other works. TheFilmAutopsy explained sequels “just make more money,” and the limited data we collected tends to agree. On average, a sequel generated box office revenues equal to ~50% of its total budget during opening weekend, whereas novel movies only returned ~41%.
In general, longer movies had moderately better reviews (r=0.52, p=.002)
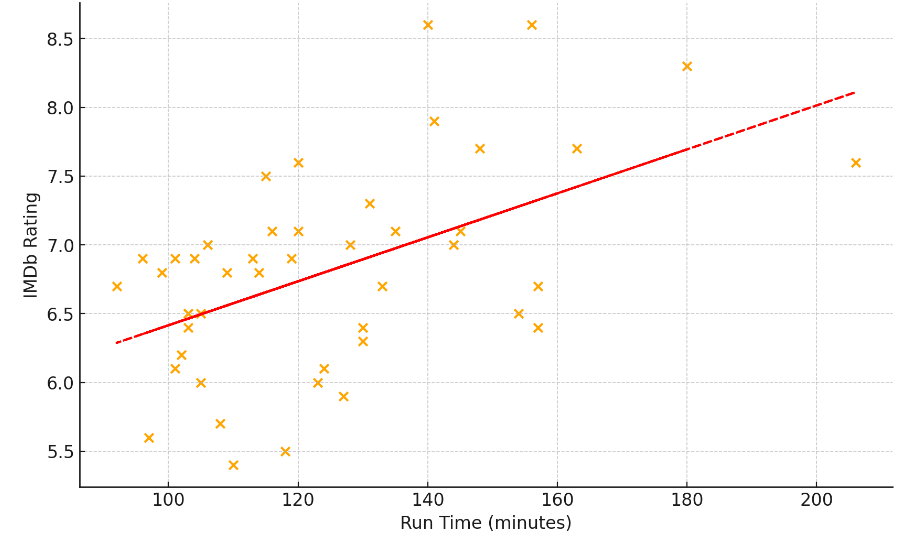
The correlation coefficient (aka “r” value) measures the strength and direction of the linear relationship between two variables. The value can range from -1 to 1. A value of 0 would indicate that two variables aren’t related at all (like your shoe size and reading ability), whereas a value of 1 indicates a perfect positive relationship between two variables (like degrees Fahrenheit and degrees Celsius). The r value of of 0.52 here indicates there’s a moderately positive relationship between a movie’s run time and it’d IMDb rating.
The p-value helps determine the significance of the results. In this scenario, the p-value is the probability of observing the results below if run time and IMDb rating were not correlated at all (meaning an r-value of 0). This dataset has a p-value of 0.0002 (0.02%), giving us confidence that these results are not random and that there is positive relationship between run time and IMDb rating. To be considered statistically significant, most fields look for a p-value of less than .05.
The line of best fit (aka regression line) shown in red is a straight line that best represents the data on the scatter plot below. The formula for the straight line can be line described by the formula y=mx+b, where y is the IMDb rating, m is the slope of the line, x is the movies run time, and b is a constant representing where the line crosses the y axis. Altogether, we can use this formula to estimate a movie’s IMDb rating as “IMDb Rating=0.016×Run Time+4.817.” The constant of 4.817 isn’t meaningful in itself, but suggest a movie with a run time of 0 minutes (a hypothetical scenario) would have an IMDb rating of 4.817. For every incremental minute, the slope of the line suggest that the IMDb rating would increase by 0.016 point.
This data makes intuitive sense given that longer movies have more time to develop characters and storylines, which could potentially lead to a better overall movie and higher ratings.
But strangely, getting better reviews doesn’t necessarily mean that more people are going to go see that particular movie on opening weekend (r=0.243, p=0.104)

The trend line in red does indicate a weak positive correlation between a movie’s IMDb rating and opening weekend box office revenue. However, the p value of 0.104 suggests that there’s a 10.4% of obtaining this result (or something even more extreme) even if the variables weren’t related at all. Based on that, we can’t confidently claim that higher IMDb ratings correlate with higher opening weekend box office revenues.
Why aren’t these variables more correlated? I had a few theories:
- Opening weekend box office revenue is probably more related to how much the production company spent on marketing and advertising for the movie beforehand. You’re probably not going to go see a movie that you’ve never heard of, right? I’ll investigate this further below. Note I would have liked to use total box office revenue instead of just opening weekend box office revenue, however it wouldn’t have been fair since several of these movies are still in theaters.
- More people want go to the movies around certain holidays or peak seasons (like Halloween or Valentine’s Day), even if the movies aren’t that great. For example, Brittany and I went to see the horror movie “Five Nights at Freddy’s” around Halloween and the romantic comedy “Anyone But You” around Valentine’s Day, even though we weren’t particularly excited about either film.
- Reviews are a lagging indicator. I’ve noticed that a movie’s IMDb rating tends to start out very high and gradually decrease over time. For example, if you go see a movie on opening night, you probably already know that you were going to like the movie before it even started. But as more people go see a movie, the rating usually decreases closer to it’s truer and long-term average. Since these movies all came out at different times, this probably isn’t a fair dataset. Or maybe IMDb is just rigged.
Just like politics, it’s all about the money. Higher movie budgets don’t lead to better reviews (r=.089, r=0.55), but they do lead to higher opening weekend box office revenue (r=0.467, p=.001).
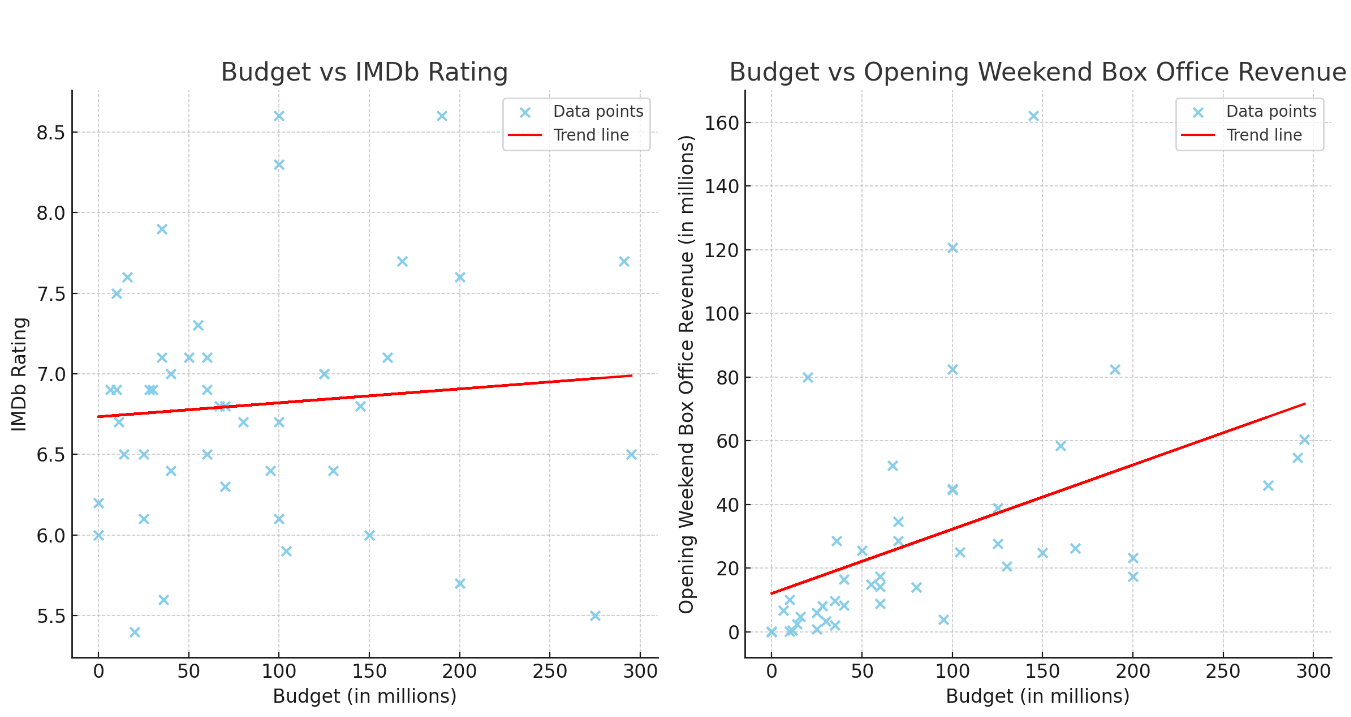
The chart on the left is all over the place, driving home the point that higher budgets don’t correlate with higher IMDb ratings. The r value indicates a weak correlation, however even if that were true, the p-value of 0.55 indicates that there’s a 55% chance that the observed data could occur even if budget and IMDb were totally unrelated. Therefore, we conclude that there’s no significant evidence that higher budgets lead to higher IMDb ratings.
On the other hand, the chart on the right indicates that higher budgets do lead to higher opening weekend box office. This isn’t a surprise. With more money, studios will bring in more famous actors, hire better producers, and spend more money on advertising. The r-value of .467 suggests a moderately positive correlation between a movie’s budget and opening weekend box office revenue, and the p value of .001 gives us high confidence that the correlation is statistically significant. The slope of the trend line (m=.202) suggests that for every additional million dollars in a movie’s budget, the opening weekend box office revenue is expected to increase by approximately $0.202 million (or $202,000).
So what does all this mean?
Our sample size is too small to reach any major conclusions other than we’ve had a great time on our 46 date nights at the movies. We’re looking forward to more movies coming up (Joker 2, Wicked, Bettlejuice, etc.), which may turn into more blog insights, but until then, check out my last movie blog where I’m “Reviewing Movie Reviewers.”